
In my previous blog I showed how to get started with Gremlin for chaos engineering. The basic steps that are needed to configure and run attacks on your host machine. In this blog I’m going to share how you can automate chaos engineering practices into your build and deployment pipeline. Just like my previous blog I have written this blog in Q&A style so that you get your answer for any specific question.
Why do I need to automate chaos engineering into my CI/CD pipeline?
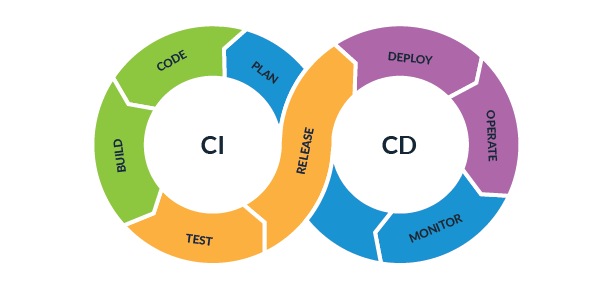
In a distributed world of microservices where a microservice is running multiple instances spread across multiple availability zones and clusters. It is very necessary to measure how much of resource utilization is taking place and what is the threshold at which the service might use up all the available resources as instances keeps multiplying depending on heavy traffic. At the time of building the service and deploying it in production environment it is necessary to gauge the resource capacity of service to be tolerant enough to withstand outages of any types. Introducing chaos attacks in CI/CD pipeline will help to identify such disruptions much before it happens in reality. Once a service is deployed, chaos attacks can be triggered from the pipeline to test whether it can withstand disruptions like CPU, Memory and Network hogging.
How do I probe the system during attack execution?
The objective of probing your system or service during the execution of an attack is to check whether the service can withstand disruptions. Gremlin comes with a feature called Status Checks which can be used to test whether a service is responsive during the timespan of an executing attack. Such probing can be done in multiple ways. One such technique is by using Webhooks. Gremlin provides multiple integration interfaces like DataDog, NewRelic and integration with other cloud providers. A detailed step-by-step instructions are provided here https://www.gremlin.com/docs/integrations/webhooks/. This blog is not about Gremlin status checks or webhooks, maybe I’ll write a separate blog on how to to integrate tools like NewRelic etc in Gremlin. So lets move on to the main theme of this blog.
How do I get started with Gremlin CI/CD Integration?
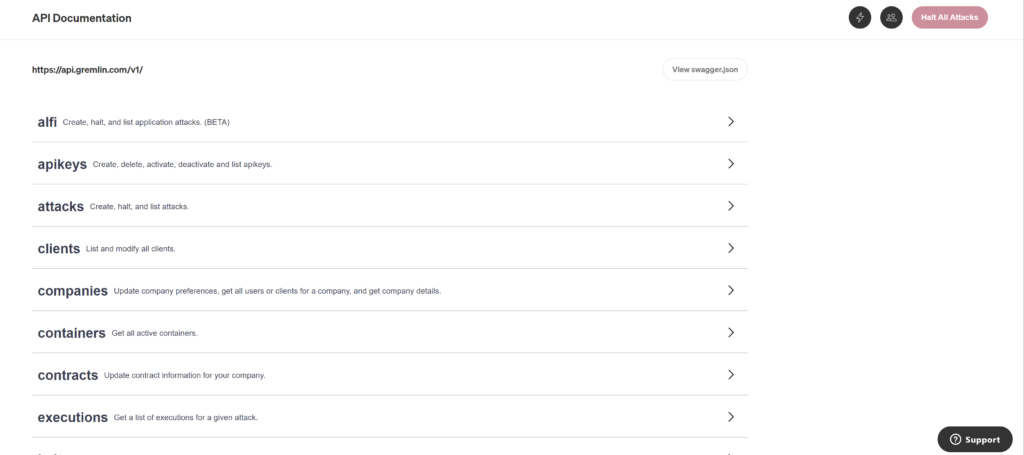
To start with an automated attack through a pipeline script, there should a way to trigger an attack from the script that should mimic exactly how a user will run an attack from the Gremlin UI. To do that there should a way to trigger attacks using API calls and also would need API calls to check the status of the attacks.Gremlin provides a list of APIs that can be used to trigger attacks and check for the status. A detailed list of gremlin APIs are available here https://app.gremlin.com/api.
What to keep in mind when calling Gremlin API?
The most important thing that needs to be understood is that there are different attacks under different categories and not all the attacks have the same parameters. So each has its own set of arguments and those arguments need to be provided as a payload when triggering the attack through the API.
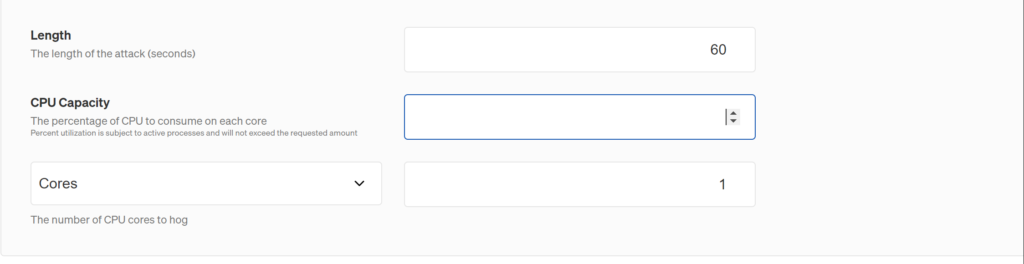
For example: If I want to run a shutdown attack, which has the least set of arguments. I would need to pass the delay and restart values. Whereas, If I need to trigger a CPU attack, I would need to pass a lot more arguments, like length of attack in secs, % of CPU to be hogged and number of cores.
Here is a sample of a JSON payload for a CPU attack:
{
“target”: {
“hosts”: {
“ids”: [
“0a0750b8-74e3-4340-83f0-3c23f9b0b0d9”
]
},
“type”: “Exact”
},
“command”: {
“type”: “cpu”,
“commandType”: “CPU”,
“args”: [
“-l”,
“60”,
“-c”,
“1”,
“-p”,
“90”
]
}
}
In the above sample, args is the parameters that are being used to trigger a CPU type attack on the Host with ID: 0a0750b8-74e3-4340-83f0-3c23f9b0b0d9.
Let us now dissect the args:
l: means length of the attack – which is 60 secs in this example
c: how many cpu cores will be impacted – which is 1 core in this example
p: percentage of cpu to be hogged – which is 90% in this example.
In your CI/CD script you should make a call to the Gremlin API passing in your TeamID and Bearer token.
https://api.gremlin.com/v1/attacks/new?teamId=c0fd31bf-9ad1-52e4-99c1-xxxx
How do I know what arguments to pass for so many different type of attacks?
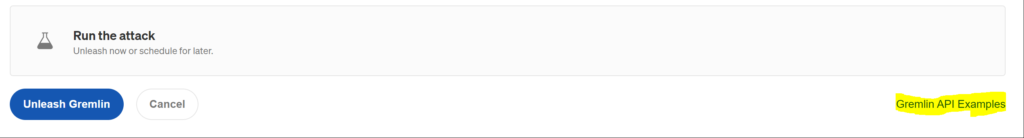
In order to capture the arguments the easiest way is to create a similar attack in the Gremlin UI and then click the Gremlin API Examples down below the “Run the Attack” frame. The example will load with a script that will contain all the necessary API details. Copy that and add it in your CI/CD pipeline.
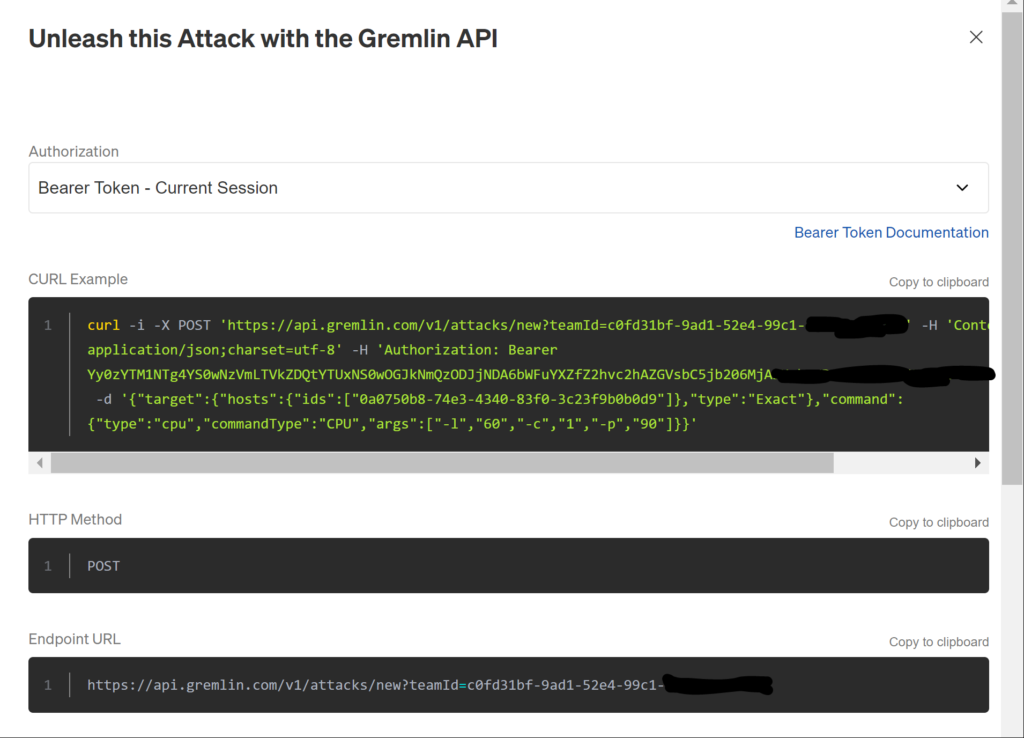
The arguments are generated once you select the attack and pass all the necessary values in the argument dialog box.
Can you show the design of the CI/CD pipeline?
Yes absolutely, that is what the purpose of this blog. I have used Gitlab as our CI/CD tool. You are free to use any CI/CD tool as per your organization standards. But whatever tool you use, the script will look more or less same.
The way we structured, I’m saying we because I have a team that takes care of the dev-ops practices and I’m their lead architect. So I will talk on behalf of them and address as ‘WE’.
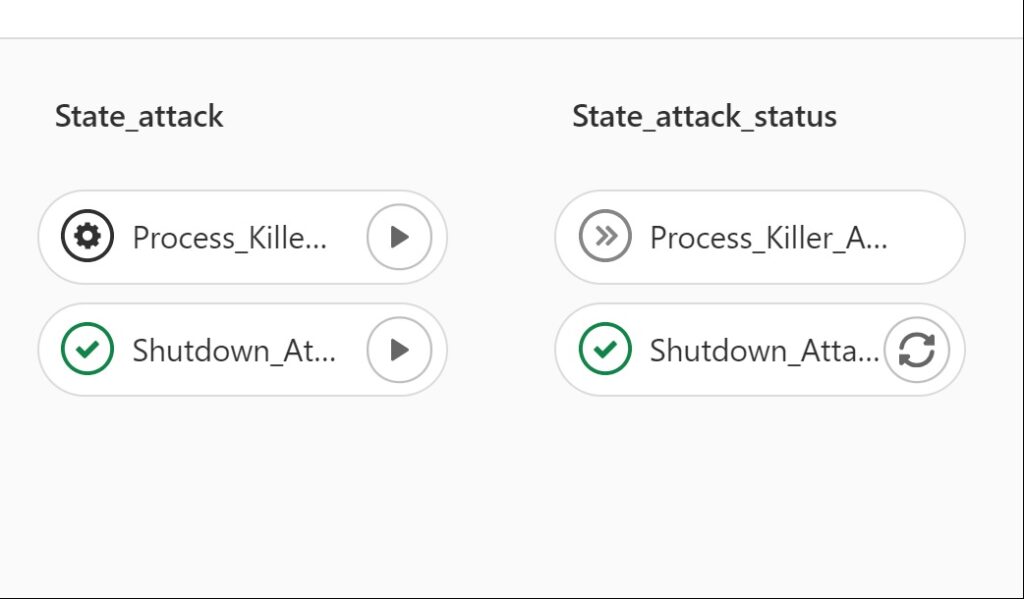
We created a replica of Gremlin UI in our CI/CD pipeline in order to facilitate the team to run any kind of attack using the pipeline without the need to use the Gremlin UI unless otherwise needed to check the status of the attacks or to generate any reports.
Here is a snapshot of how it looks:

We have created separated pipeline stages for different categories of attacks and their status checks. The first category is Resource Attack followed with its Resource Attack status checks, the next category is State Attacks and the last being Network Attacks. You can trigger any attack by clicking on the play button.
For every individual attack we have created a payload.json file that will have all the arguments and other metadata needed to execute an attack. In the example shown below we have created a payload.json file that connects to a kubernetes cluster and executes a CPU attack.
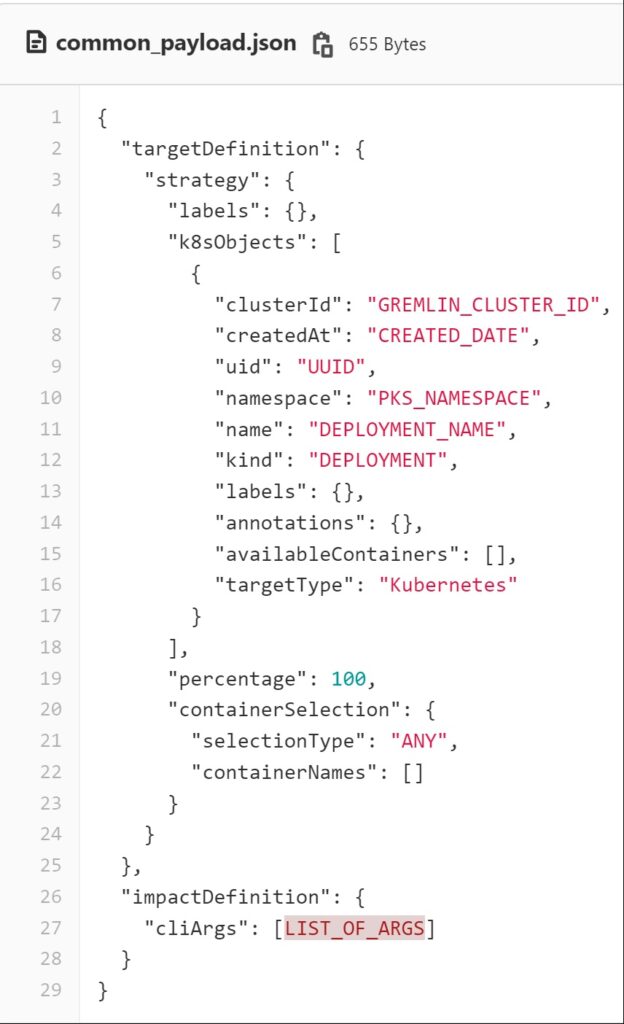
The k8sObjects: this is object that contains all the info about the host kubernetes cluster, like the cluster name, namespace where the pod is hosted and the service name which is the target for the chaos attack.
ImpactDefinition: This contains all the arguments that needs to be passed when running the attack. I have explained that in What to keep in mind when calling a Gremlin API section.
Can you show some code snippet of the CI/CD Script?
Yes, That is the last section of this blog. I have used Gitlab as I mentioned before, so .gitlab-ci.yml file is the main entry point for an executable pipeline script in gitlab.
First define all the stages that you want to incorporate in your pipeline, as shown below:
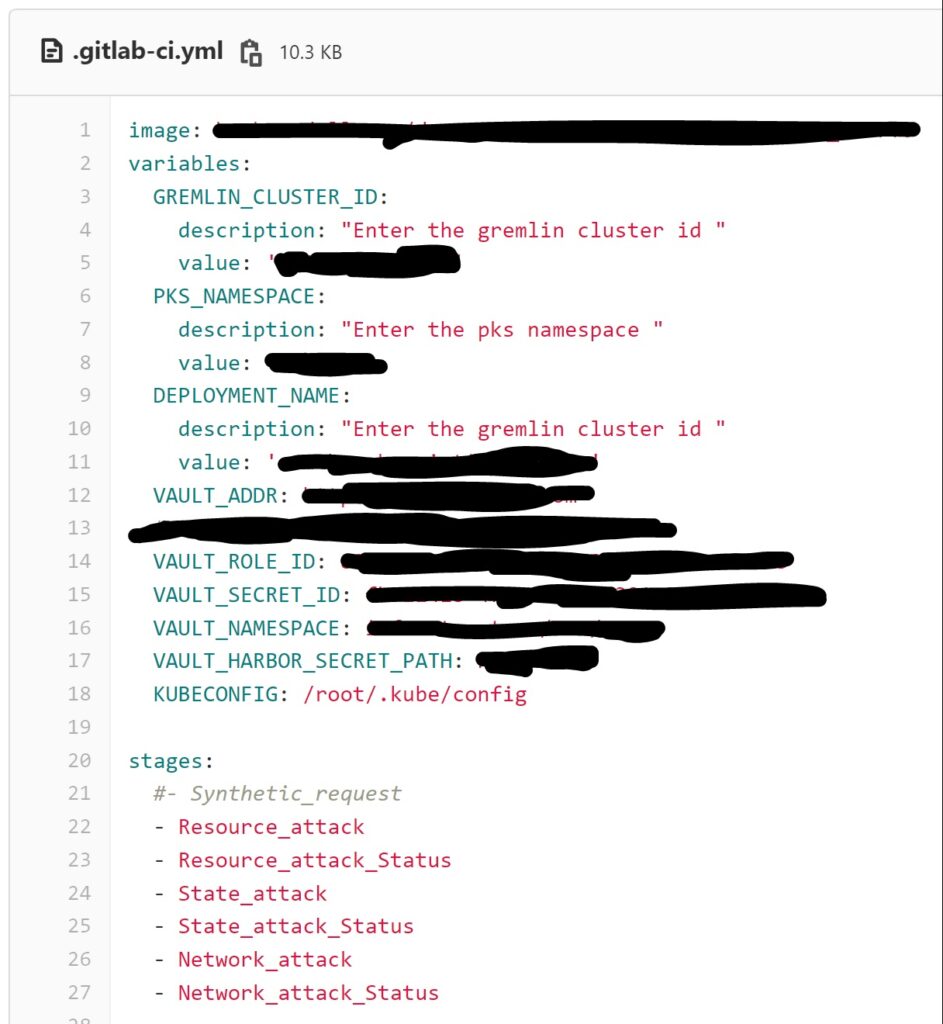
As you see, we define the credentials for connection to the kubernetes cluster. We store all our credentials in Vault and our container images in Harbor.
Next in the .before-script we parse the metadata which we configured above.

Then we parse the payload.json entries by running the sed command
sed -i -e “s/CREATED_DATE/$CREATED_DATE/” -e “s/UUID/$UUID/” -e “s/GREMLIN_CLUSTER_ID/$GREMLIN_CLUSTER_ID/g” -e “s/PKS_NAMESPACE/$PKS_NAMESPACE/g” -e “s/DEPLOYMENT_NAME/$DEPLOYMENT_NAME/g” -e “s#LIST_OF_ARGS#$LIST_OF_ARGS#” common_payload.json
cat common_payload.json
After that trigger the attack by running the curl command as shown below:
curl -i -X POST -o result.json “https://api.gremlin.com/v1/kubernetes/attacks/new?teamId=${TEAM_ID}” -H ‘Content-Type: application/json;charset=utf-8’ -H “Authorization: Key ${Authorization_Key}” –data @common_payload.json
echo “=============================================”
echo -e “${BLUE}| Experiment started | ${ENDCOLOR}”
echo “=============================================”
As you see, this command will execute the Gremlin attack by passing in all the necessary values using Gremlin API.
Next we need to write the status_check script as shown below:
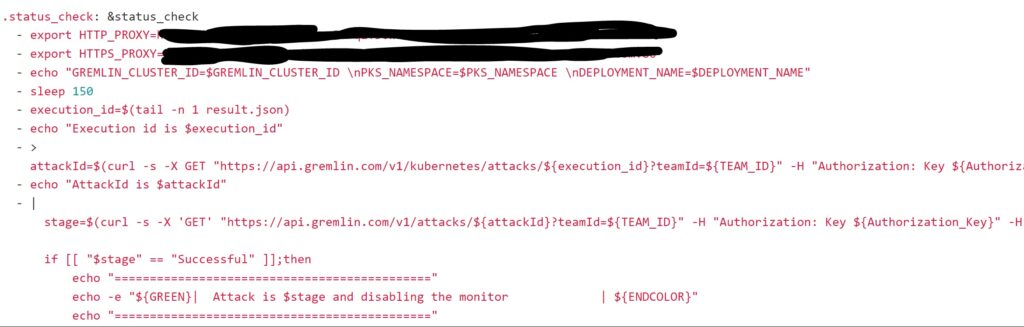
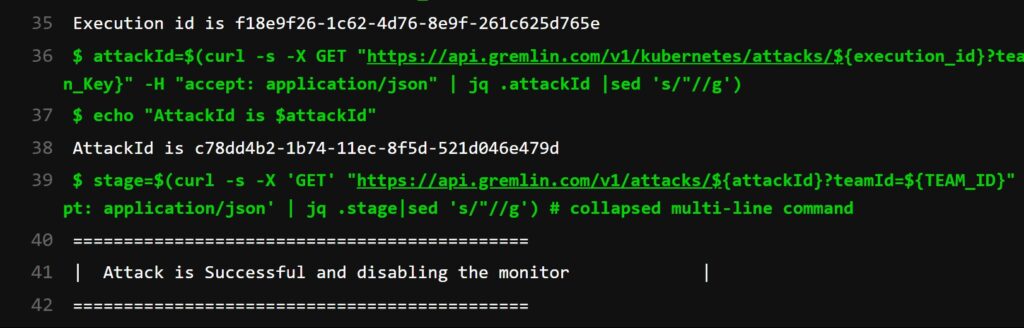
As you see in the above snapshot, to get the status of the attack first you need to fetch the execution_id from the results.json file that has been generated at the time of running the attack and then pass the execution_id to a gremlin API https://api.gremlin.com/v1/kubernetes/attacks/${execution_id}?teamId=${TEAM_ID} to get the attackid.
To get the final result of the attack whether it was successful or failed you need to pass the attackid to a gremlin API as shown below:
stage=$(curl -s -X ‘GET’ “https://api.gremlin.com/v1/attacks/${attackId}?teamId=${TEAM_ID}
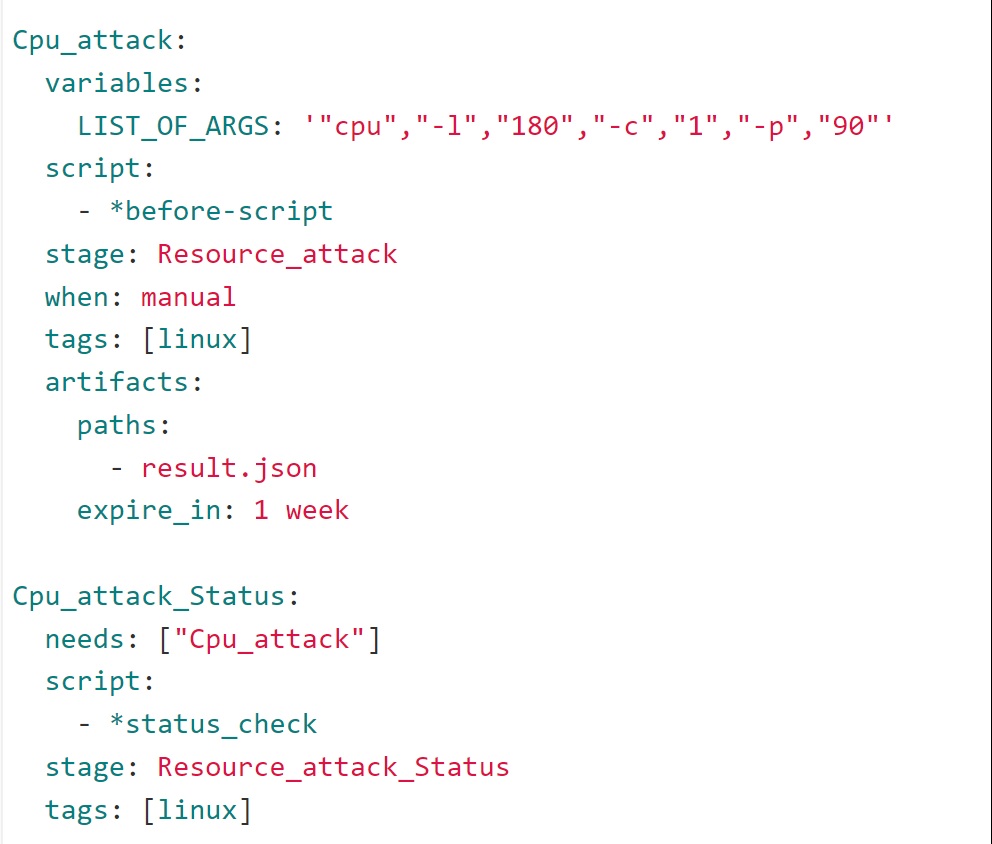
Finally you call these scripts in the job for that stage. For example: If I want to run a Resource attack which is of CPU type, I would write a job as shown below:
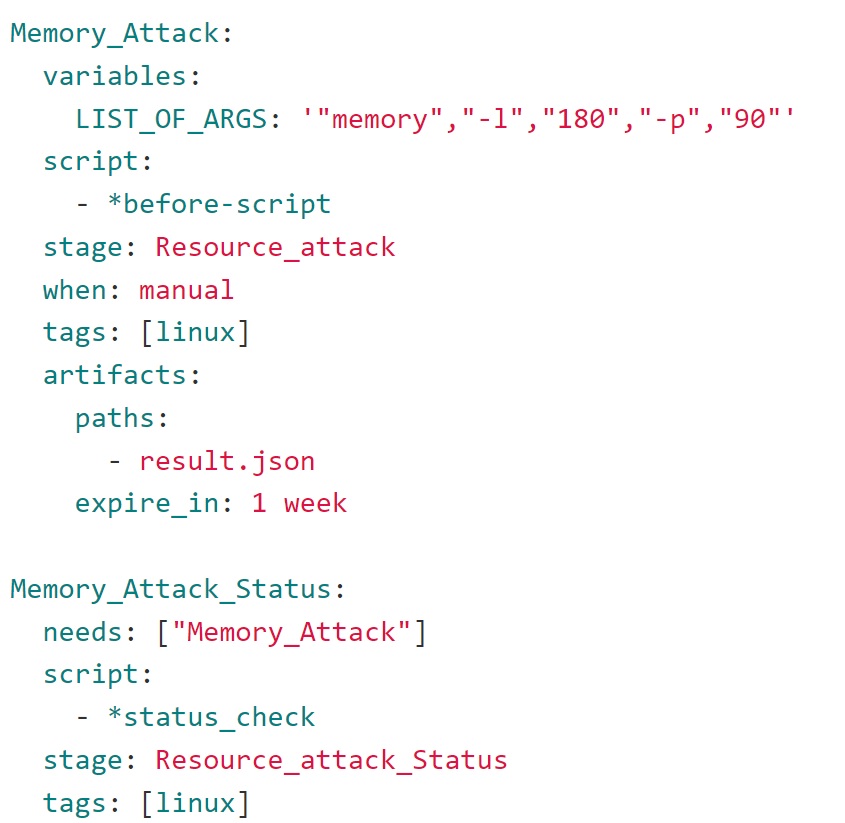
If you want to perform a memory attack, all you have to do is to write a job for a memory attack, very similar to the one shown here:
Click on the play button on your Gitlab pipeline screen to start the job which you want to run an attack for. You should see the pipeline triggers a call to gremlin API and the selected attack is triggered.
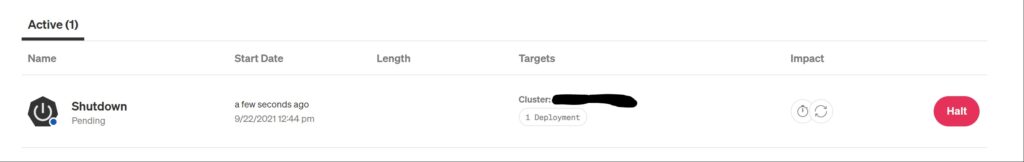
After triggering your attack, if you login to Gremlin UI and click on Attacks. You should see an active attack as shown here:
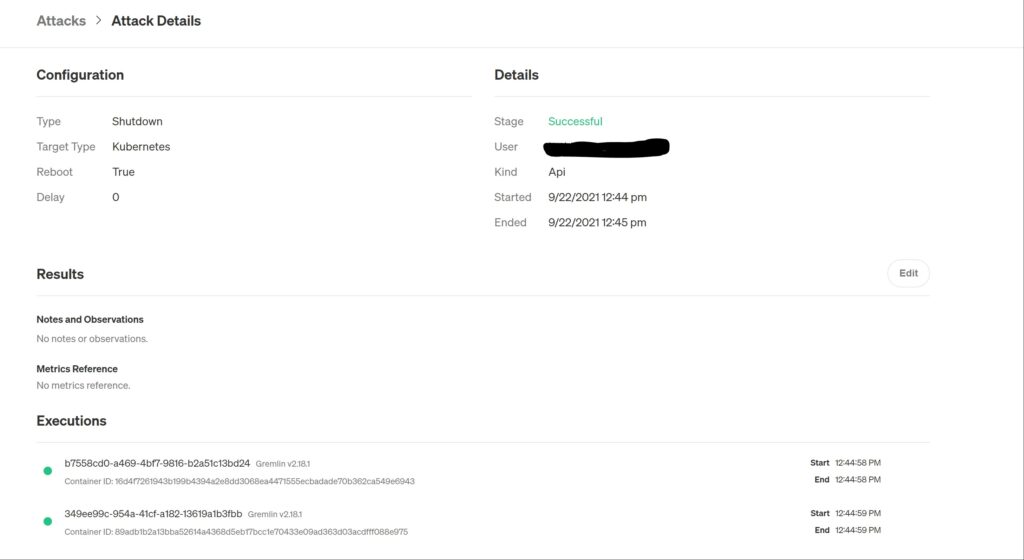
If you go to Attack details screen, a detailed report will show up with the execution details.
Similarly, if you now go back to your Gitlab pipeline window for the executing job, you should see the job has been completed.

Now the final step is to verify the Stage in our Status_Check job and verify whether you got the same Successful message as shown in the Gremlin portal. As you see in Line #41, Attack is Successful. This clarifies that we got the right response from the Gremlin API.
I hope you guys now have a basic idea on how to setup Gremlin in your CI/CD pipeline. If you have any questions please drop a note in the comments section. I would be glad to answer those.
Till I come up with my next blog. Keep exploring!
P.S. Special thanks to my friend Kathiravan who helped in writing the Gremlin chaos engineering CI/CD pipeline.
Kathiravan – YOU ROCK!